

Geothermal Facts and Stats #2
When promoting the industry, it’s important to remember the basics. The Geothermal Facts and Stats campaign will dive into many facets of the industry ranging from utility power and direct use to geology, drilling, power plants and country-specific updates. However, before we get to those details, we will lay the foundation by illustrating and articulating the basics of geothermal. Consider this the “Geothermal 101” of our #GeothermalFactsandStats Campaign.
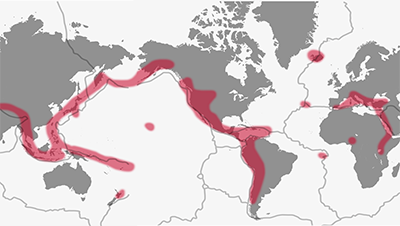
This Geothermal Fact and Stat promotes one of the more iconic world maps that shows plate tectonics and the volcanic “ring-of-fire”. Both of which are highlighted in red. The red represents known geothermal energy zones where the production is most commercially viable. In other words, the geothermal resource is closer to the surface (volcanos/tectonic activity) and therefore shallower to drill for and more cost-effective to develop.

Geothermal Facts and Stats – Geothermal Potential Map