Geochemical studies are vital for and often applied to every phase of geothermal exploration and development. From estimating subsurface temperatures during exploration to providing data on the water-to-steam ratio of the reservoir in production to identifying changes in geothermal fluids during production. Geochemistry is known for its graphs, charts and ternary diagrams (triangular graphs). But there are instances in the geothermal industry where we create geochemical maps.
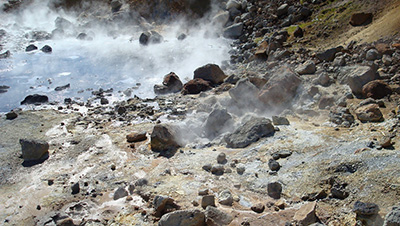
In potential geothermal areas, it is important to carry out geochemical analysis of surface manifestations (hot/warm springs, fumaroles, mud pools etc.). These help us to:
- Determine the origin of the fluid;
- Define its chemical characteristics;
- Estimate subsurface temperatures; and
- Provide data towards the development of a conceptual model of the system.
Once geothermal and alteration maps have been created, a geochemical analysis is carried out on samples from alteration zones. X-ray fluorescence (XRF) is one of several techniques that can be used to identify the minerals present in the zones. Combining the results with geologic mapping and geophysical (resistivity) surveys we can map the extent of the alteration zones (clay cap/seal). Continuous mapping of alteration zones and their extent have been used to monitor surface manifestations’ response to production.
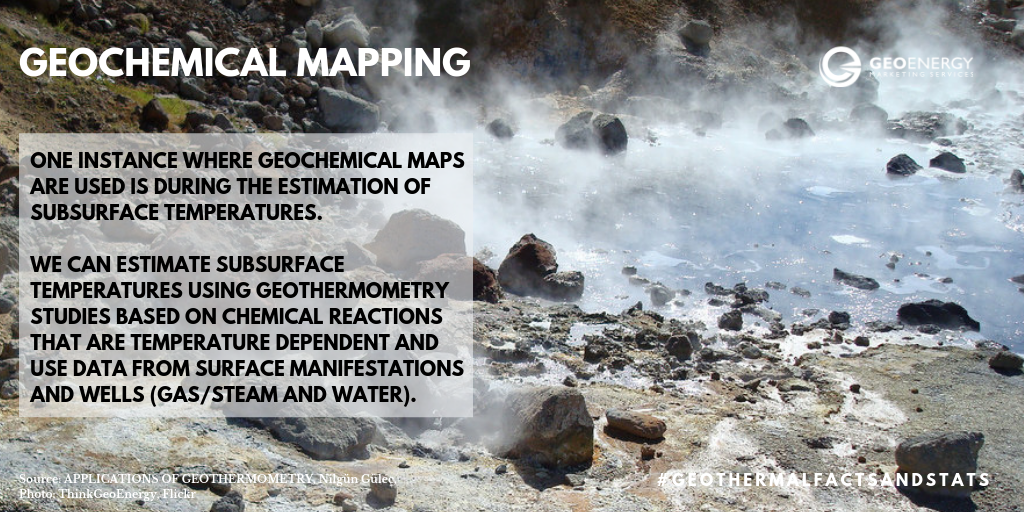
Another instance where geochemical maps are used is during the estimation of subsurface temperatures. We can estimate subsurface temperatures using geothermometry studies. This is based on chemical reactions that are temperature dependent and use data from surface manifestations and wells (gas/steam and water). You can find an in-depth look at geothermometry here. In areas with geothermal fluid at the surface, chemical (Silica, Sodium, Potassium, Magnesium, and Calcium) and isotopic geothermometers are utilized (e.g Iceland). In other cases where only gas or steam is present, gas (CO2, H2S, and H2) and isotopic geothermometers (e.g. Kenya) are used. Regardless of the type utilized, there is the generation of a temperature distribution map.
 Image 1: Temperature distribution, based on geothermometry, Kenya ( from Karingithi 2009)
In the previous Mapping post, we mentioned the existence of blind geothermal systems. These systems show little to no surface features making it a challenge for us to identify them. In many cases, we have semi-blind geothermal systems showing minor surface features, e.g. Maui, Hawaii and the Menengai and Silali geothermal areas in Kenya. One method of identifying these systems relies on the study of soil diffuse degassing (more details can be found here). The results are used to produce soil gas surveys. The survey is based on the presence and ratios of Carbon Dioxide (CO2) and Thoron gas (Radon 220/Rn220) in soils. The survey measures the concentrations and the flux (rate of release) of these gases. Research has shown that CO2 and other gases of magmatic origin travel to the surface along faults. Thus, elevated gas values (CO2 and Thoron gas) are useful for identifying potential permeable zones, geologic structures, and faults. It also provides data on the chemical and thermal evolution of hydrothermal areas. This method has been used in Kenya during the exploration phase and for monitoring of surface manifestations during production (See figure of soil gas survey CO2 distribution of Silali geothermal area).
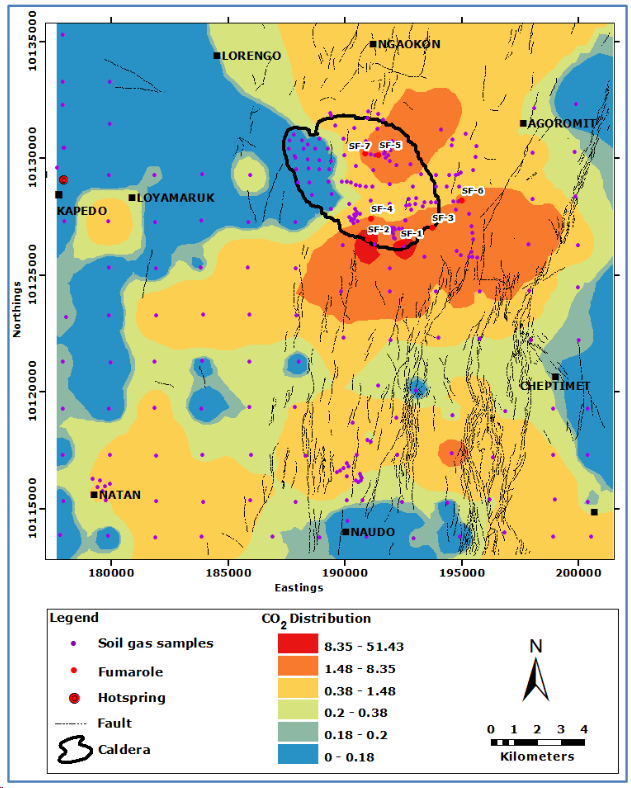 Image 2: Soil Gas Survey, CO2 distribution, Silali Prospect, Kenya (from Kipng’ok, J and Kanda, I. 2014)
Even though geochemical studies are graph heavy, there are three times where maps are created: alteration studies, geothermometry studies, and soil gas surveys.
This concludes our post on geochemical mapping in geothermal energy. Check back next week where we talk about geophysical mapping. For more #GeothermalFactsandStats, follow us on all major social media platforms.
Guest Blogger: Jason Fisher
Sources:
Exploring for Hidden Geothermal Systems Proceedings World Geothermal Congress 2010 Bali, Indonesia, 25-29 April 2010, 7 pp https://pdfs.semanticscholar.org/cc67/126a2e1f2616f780c80ed4cd9c5e45957501.pdf Accessed on March 22, 2019
Hogenson, J., 2017, Geothermal Surface Mapping and Chemical Sampling in Krýsuvík at: Seltún, Trölladyngja, and Austurengjar, MSc thesis School of Science and Engineering at Reykjavík University, 112 pp, https://skemman.is/bitstream/1946/28732/1/MSC-JULIANNAMHOGENSON-2017.pdf Accessed on March 23, 2019.
International Geothermal Association Service GmbH, 2014, Best Practices for Geothermal Exploration, c/o Bochum University of Applied Sciences (Hochschule Bochum), Lennershofstr, 140, D-44801, Germany, 195 pp.
Karingithi 2009, Chemical geothermometers for geothermal exploration, Presented at Short Course IV on Exploration for Geothermal Resources, organized by UNU-GTP, KenGen and GDC, at Lake Naivasha, Kenya, November 1-22, 2009, 12 pp https://orkustofnun.is/gogn/unu-gtp-sc/UNU-GTP-SC-10-0603.pdf Accessed on March 22, 2019
Kipng’ok, J. and Kanda, I. 2014, Introduction to geochemical mapping Presented at Short Course IX on Exploration for Geothermal Resources, organized by UNU-GTP, GDC and KenGen, at Lake Bogoria and Lake Naivasha, Kenya, Nov. 2-23, 2014, 13 pp
https://orkustofnun.is/gogn/unu-gtp-sc/UNU-GTP-SC-19-0106.pdf Accessed on March 21, 2019
Malimo,S. J., 2012, Use of Radon and Carbon Dioxide in Geochemical Exploration of Menengai and Silali Geothermal Prospects, Kenya, Proceedings of the 4th African Rift Geothermal Conference 2012 Nairobi, Kenya, 21-23 November 2012, 7 pp https://www.geothermal-energy.org/pdf/IGAstandard/ARGeo/2012/Malimo2.pdf Accessed on March 21, 2019
Muga, J., XXXX(?), Geochemical assessment using radon and carbon dioxide concentration levels from soil gas survey, a case study of morendat east geothermal prospect, Kenya, 13 pp http://theargeo.org/fullpapers/GEOCHEMICAL%20ASSESSMENT%20FOR%20THE%20MORENDAT%20EAST%20GEOTHERMAL%20PROSPECT.pdf Accessed on March 23, 2019
Ólafsson, M., XXXX (?) Geochemical methods in geothermal exploration and exploitation, a powerpoint presentation by Iceland GeoSurvey (ÍSOR), 33 pp http://engine.brgm.fr/web-offlines/conference-Mid-Term_Conference_-_Potsdam,_Germany/other_contributions/39-slides-0-Olafsson.pdf Accessed on March 20, 2019.