Mapping a Powerful Tool in geothermal exploration and development: Geological Mapping
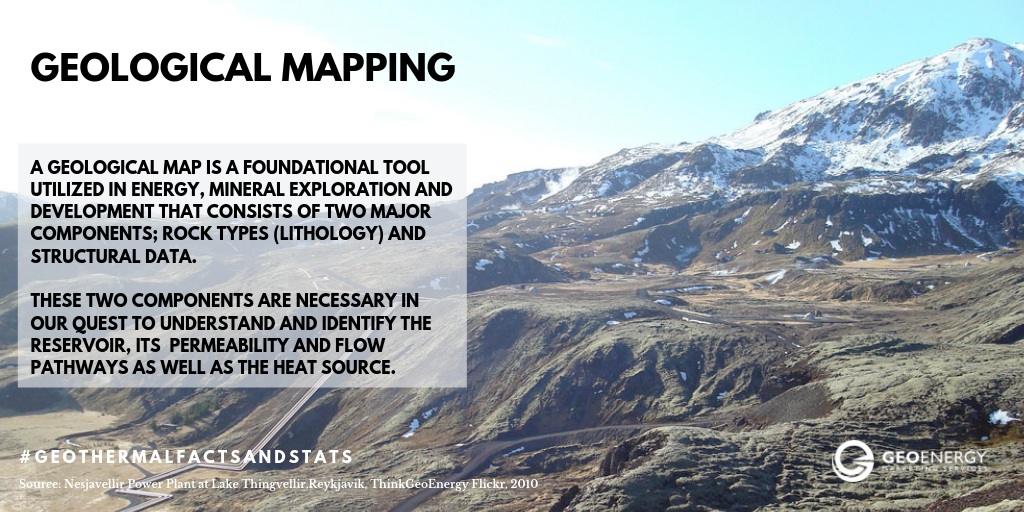
The successful exploration and development of geothermal energy lie in understanding the resource. Similar to oil and gas, a conventional geothermal field must have a source, reservoir and a cap (a seal). A geological map is the first step towards identifying these. It is a foundational tool utilized in energy, mineral exploration, and development that consists of two major components, rock types (lithology) and structural data. These two components are necessary for our quest to understand and identify the reservoir, its permeability, flow pathways as well as the heat source.
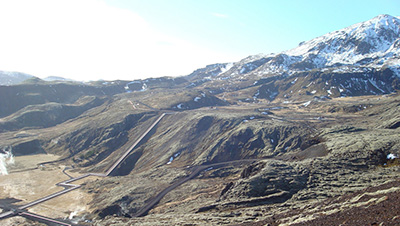
However, in our pursuit to harness geothermal energy, one of the first maps created and still being used today is that of geothermal manifestations. These are surface features resulting from hot water/steam reaching the earth’s surface. The most commonly mapped features include hot/warm springs, geysers, and fumaroles (example from southwest Iceland). These features have been used for entertainment purposes since antiquity. The world’s first geothermal plant was located in southern Tuscany, Italy in 1904 due to the presence of hot springs. Since then many geothermal maps have been created using the occurrence of these surface manifestations. However, there are blind geothermal systems where there is no surface expression. In those cases, we can use other geochemical techniques that will be discussed in next week’s post.

Image: Seltύn Geothermal Manifestation Map, southwest Iceland (from Hogenson, J., 2017)
The occurrence of surface manifestations is tied to the local/regional geological setting which is globally diverse. This often reflects the presence of tectonically (volcanoes and earthquakes) active zones. Take for example the Pacific Ring of fire, it hosts more than 400 volcanoes and earthquake zones and is home to >80% of the top 10 geothermal producers of 2018. Remember that one critical question to answer during geothermal exploration and development is what is the flow pattern and permeability of the potential reservoir. Faults and fractures associated with these tectonically active zones contribute to the permeability of geothermal reservoirs. Understanding their distribution can help us predict permeability at depth.
To understand geological structure we create structural maps. A traditional structural map focuses on mapping faults and fractures by defining their orientation (strike and dip) and their relationships. Satellite images and aerial photographs are used to aid in their identification prior to fieldwork. Structural maps can also be combined with elevation data and geophysical maps helping us to identify physical features such (craters and calderas) mineral alteration and lithology (See Geological Map of Olkaria, Kenya).
The lithology in geothermal areas and reservoirs vary widely. Their distribution and relationships can help us provide an estimate for the temperature in the reservoirs. In certain areas, the presence of particular rocks (acidic igneous rocks) indicates the presence of a shallow heat source. Although igneous/metamorphic rocks are common reservoirs, sedimentary reservoirs exist in fields in western Canada (Saskatchewan), California (The Geysers) and Japan (Mori Field). Mapping of rock types is fundamental to geology and results in a lithological map showing the spatial extent and describes their main characteristics (texture, color, mineralogy) [See Geological Map of Olkaria, Kenya]. Accompanying this is a graphic log showing the vertical sequence and relationship between the rock units.
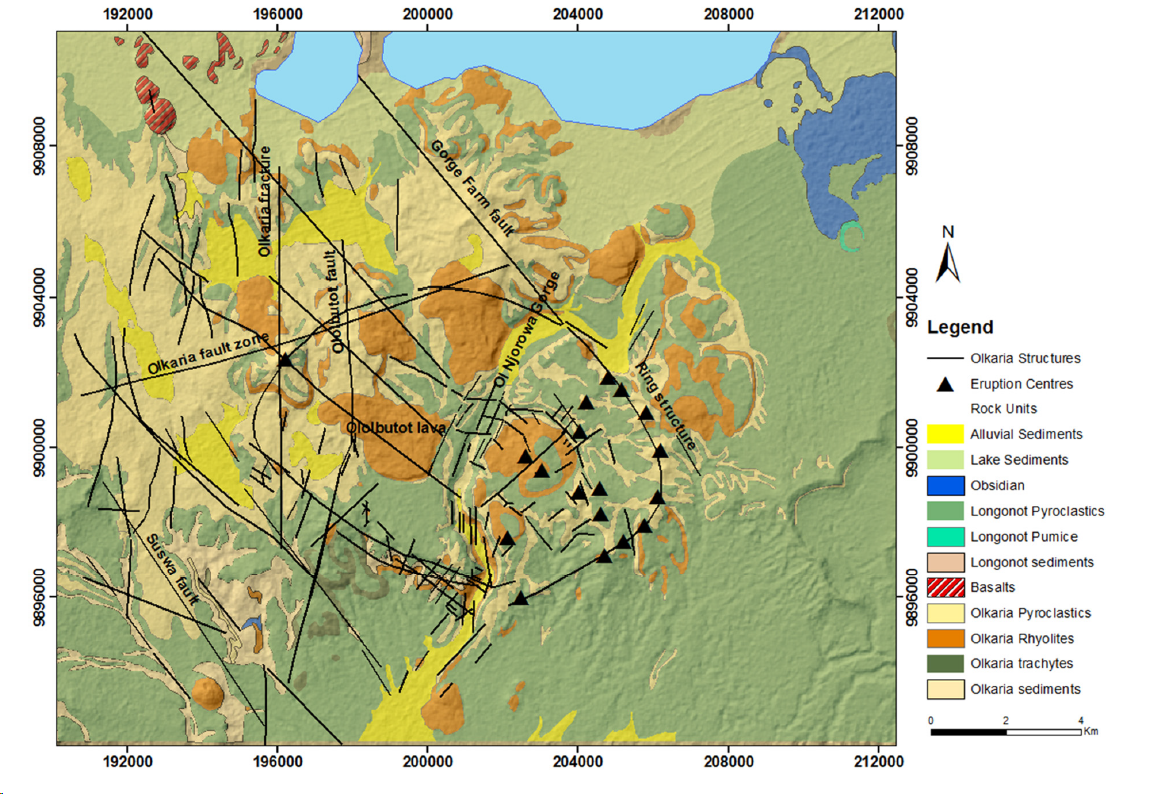
Image: Geological surface map of Greater Olkaria geothermal area, Kenya (From Munyiri 2016)
The main features of rocks in a geothermal region are altered by the presence of tectonic activity and hot fluids. As this hot fluid moves through the faults and fractures in rocks they alter the chemistry and mineralogy of rocks. This is known as hydrothermal alteration. This alteration varies based on the initial composition of the rocks and includes mineral replacement, mineral deposition and physical changes such as density. Alteration mapping focuses on the style, intensity, and mineralogy and provides vital information on the hydrology and thermal history of the geothermal system.
Up until now, the focus has been on geological mapping on the surface. Subsurface geological mapping is typically done using geophysical methods which will be described in a later post. Regardless we use two non-geophysical methods to map the subsurface: cross sections and mud logs. Cross sections are vertical slices through the earth used to identify lithological and structural relationships. A mud log or geological log is the result of chipping descriptions during the drilling of a well. This records lithological and mineral alteration as well as downhole temperatures. These subsurface ‘maps’ help us determine the characteristics and thickness of the reservoir and cap. Mud logs can be combined with geophysical logs to create 2D and 3D models.
This wraps up our 1st of a Series on “Mapping” #GeothermalFactsandStats posts on geological mapping in geothermal energy. Check back next week when we discuss geochemical mapping mentioned earlier in the post.
Author: Jason Fisher
SOURCES:
DEEP energy, 2019, DEEP successfully completes first geothermal test well, published on January 11, 2019, https://deepcorp.ca/deep-successfully-completes-first-geothermal-test-well/ Accessed on March 14, 2019
Geothermal Training Programme Reykjavík, Iceland, ISBN 978-9979-68-409-1
Hanano M., Kajiwara T., Hishi Y., Fumiaki Arai, F., Asanuma, M., Sato, K., and Takanohashi, M., 2005, Overview of Production at the Mori Geothermal Field, Japan, Proceedings World Geothermal Congress 2005 Antalya, Turkey, 24-29 April 2005, 10 pp https://www.geothermal-energy.org/pdf/IGAstandard/WGC/2005/0906.pdf Accessed on March 14, 2019
Hogenson, J., 2017, Geothermal Surface Mapping and Chemical Sampling in Krýsuvík at Seltún, Trölladyngja, and Austurengjar, MSc thesis School of Science and Engineering at Reykjavík University, 112 pp, https://skemman.is/bitstream/1946/28732/1/MSC-JULIANNAMHOGENSON-2017.pdf Accessed on March 15, 2019
International Geothermal Association Service GmbH, 2014, Best Practices for Geothermal Exploration, c/o Bochum University of Applied Sciences (Hochschule Bochum), Lennershofstr, 140, D-44801, Germany, 195 pages.
ISSN 1670-7427, 64 pp http://www.unugtp.is/ Accessed on March 15, 2019 [source of Geological Map of Olkaria, Kenya]
Larderello Worlds First Geothermal Power Station http://www.reuk.co.uk/wordpress/geothermal/larderello-worlds-first-geothermal-power-station/ Accessed on March 13, 2019
Lebel, Daniel (editor) 2009, Geoscience Needs for Geothermal Energy Development in Western Canada: Findings and Recommendations, British Columbia Ministry of Energy, Mines and Petroleum Resources, Petroleum Geology Open File 2009-03, 18 pages.
Lippmann, M., Truesdell, A., Frye, G., The Cerro Prieto, and Salton Sea Geothermal Fields- Are they really alike? Proceeding of the 24th workshop on geothermal reservoir engineering Stanford University, Stanford, California, January 25-27, SGP-TR-162.
Moeck, I. S., 2014, Catalog of geothermal play types based on geologic controls, Renewable and Sustainable Energy Reviews 37, pp 867- 882, http://dx.doi.org/10.1016/j.rser.2014.05.032
Munyiri., S., 2016, Structural Mapping Of Olkaria Domes Geothermal Field Using Geochemical Soil Gas Surveys, Remote Sensing And Gis, MSc thesis School of Engineering and Natural Sciences Faculty of Earth Sciences, University of Iceland, United Nations University
Oregon State University, Volcano World, What is the Ring of fire, http://volcano.oregonstate.edu/what-quotring-firequot accessed on March 13, 2019
Steingrimsson, B., and Gudmundsson, A., 2006, Geothermal Borehole Investigations During And After Drilling, Presented at Workshop for Decision Makers on Geothermal Projects in Central America, organized by UNU-GTP and LaGeo in San Salvador, El Salvador, 26 November to 2 December 2006, 10 pp, https://orkustofnun.is/gogn/unu-gtp-sc/UNU-GTP-SC-02-28.pdf Accessed on March 14, 2019
Stober, I., and Bucher, K., 2013, Geothermal Energy: From Theoretical Models to Exploration and Development, Springer-Verlag Berling Heidelberg, 291 pages, DOI 10.1007/978-3-642-13352-7
Thinkgeoenergy, 2019, The Top 10 Geothermal Countries 2018 – based on installed generation capacity (MWe), http://www.thinkgeoenergy.com/the-top-10-geothermal-countries-2018-based-on-installed-generation-capacity-mwe/ accessed on March 13, 2019
USGS, The Geysers Geothermal field, https://volcanoes.usgs.gov/volcanoes/clear_lake/geo_hist_geysers.html Accessed on March 14, 2019